Measuring Success
How we PRESERVE
2023
METRIC 1
Protected Open Space
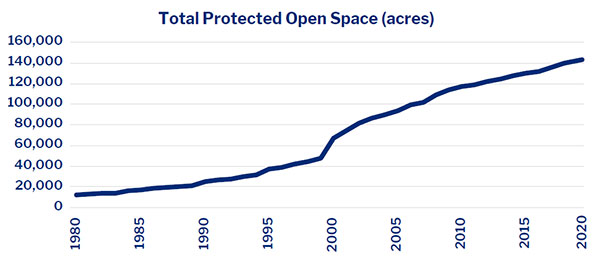
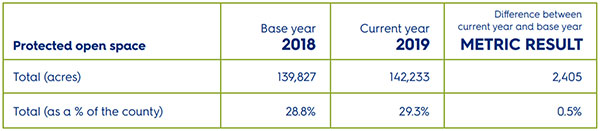
Track the percentage of permanently protected open space within the county, including farmland, nature preserves and parks.
METRIC result
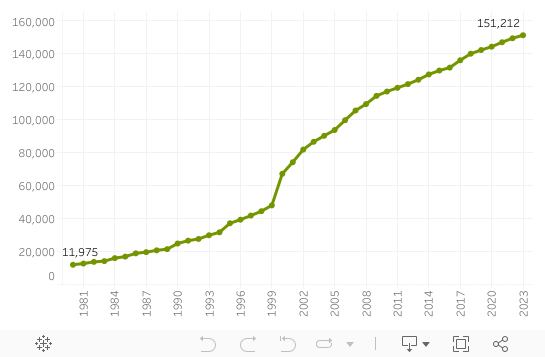
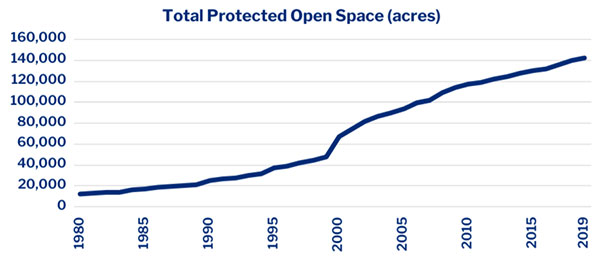
There was a major increase in Protected Open Space in the early 2000s. However, the properties protected were often on isolated properties. Compared to back then, there are fewer acres protected each year, but the lands being protected are serving as links to create large-scale, multimunicipal networks.

Total Protected Open Space (acres)
METRIC 2
Open Space Connectivity
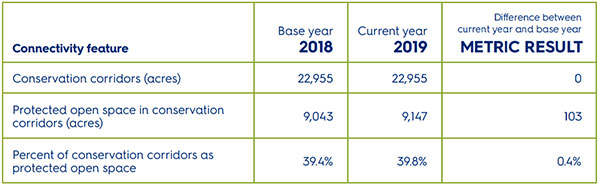
Monitor protected open space within the conservation corridors.

METRIC result
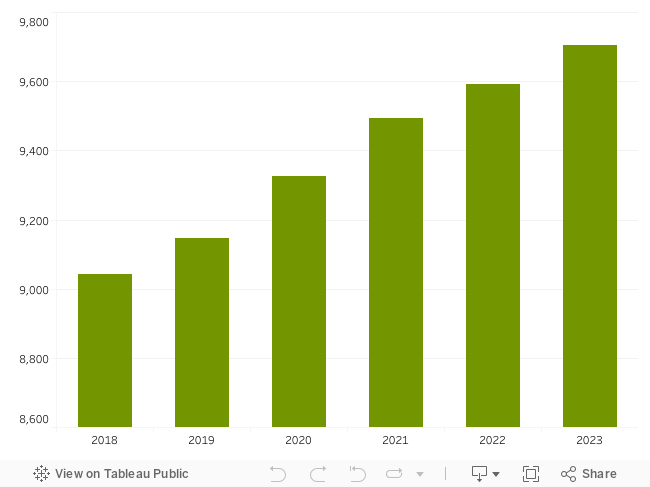
Metric 1 indicates that from 2018 to 2023, the total acreage of protected open space in Chester County rose by 2.3%. During that time, the increase was 2.9% within conservation corridors. Clearly, the preservation within conservation corridors is keeping pace with overall open space preservation.

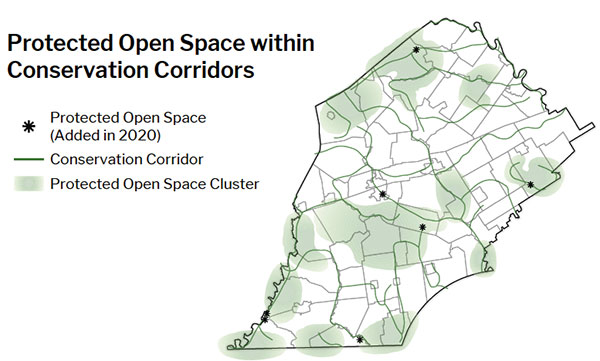
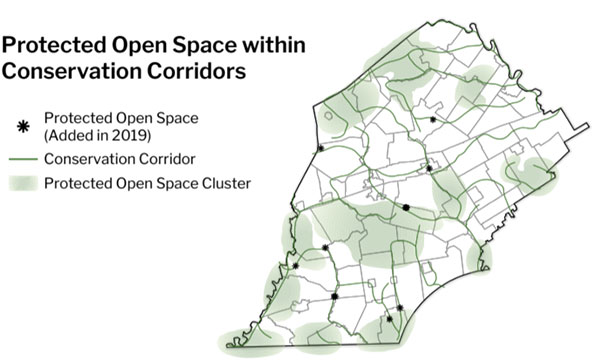
Protected Open Space within Conservation Corridors
METRIC 3
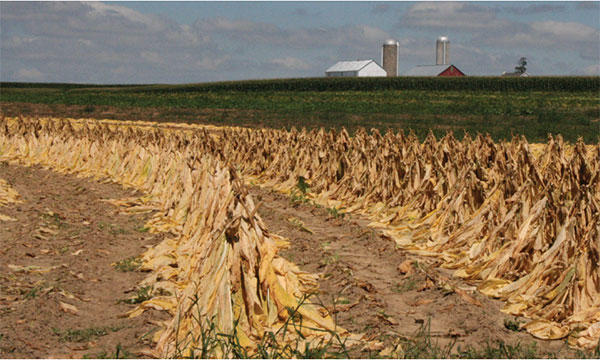
Protected Farmland
Track the percentage of farmland that is eligible for an agricultural conservation easement and has been protected from development.
METRIC result
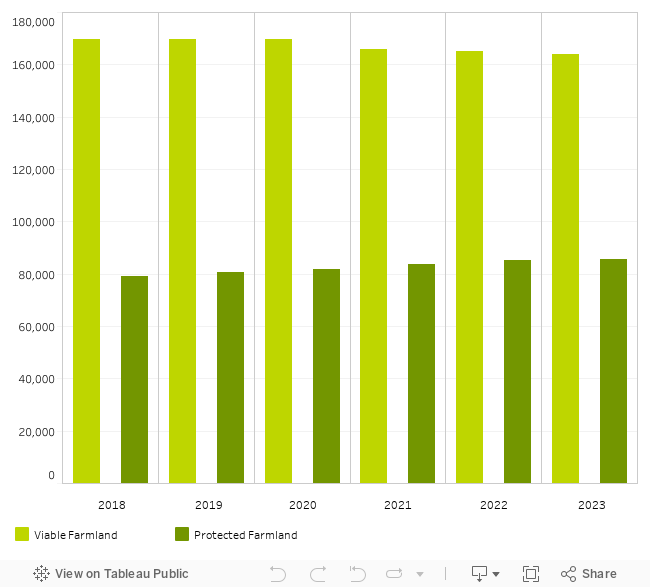
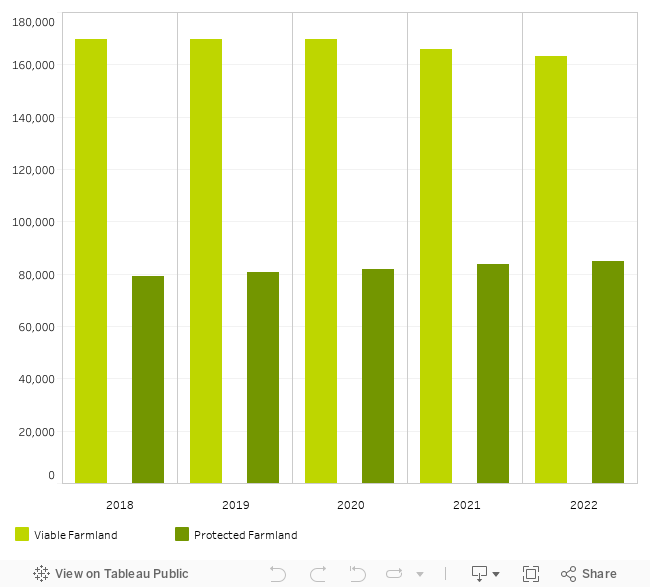
There has been a gradual decline in viable farmland, which occurs when land is consumed for development. However, the amount of farmland protected from development has increased by a somewhat greater amount.

Viable and Protected Farmland
2022
METRIC 1
Protected Open Space
Track the percentage of permanently protected open space within the county, including farmland, nature preserves and parks.
METRIC result
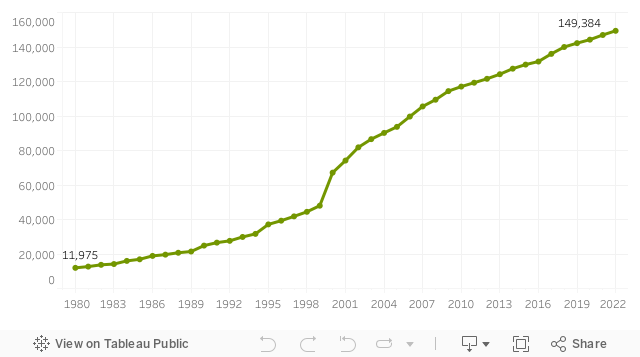
During 2022, the amount of open space preserved, both with and without county funding, rose to 149,384 acres. This represents an increase of 9,386 acres (or 1.9%) relative to the base year.
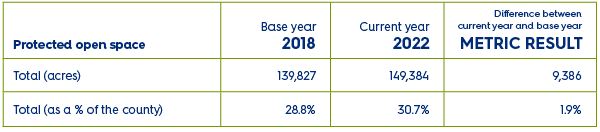
Total Protected Open Space (acres)
METRIC 2
Open Space Connectivity
Monitor protected open space within the conservation corridors.
METRIC result
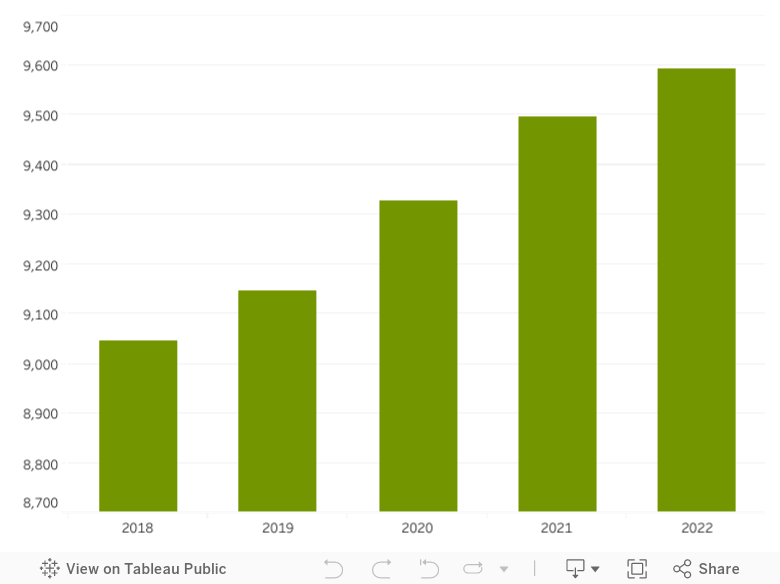
During 2022, the amount of open space preserved within the 1/8th mile wide conservation corridors rose to 9,591 acres. This represents an increase of 548 acres relative to the base year.

Protected Open Space within Conservation Corridors
METRIC 3
Protected Farmland
Track the percentage of farmland that is eligible for an agricultural conservation easement and has been protected from development.
METRIC result
During 2022, the amount of viable farmland eligible for easement that has been protected from development rose to 85,083 acres. This represents an increase of 5,999 acres relative to the base year.
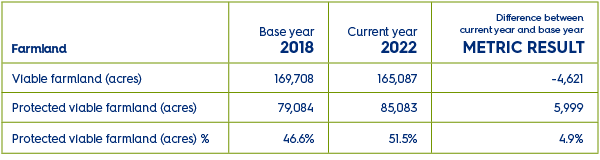
Viable and Protected Farmland
2021
METRIC 1
Protected Open Space
Track the percentage of permanently protected open space within the county, including farmland, nature preserves and parks.
METRIC result
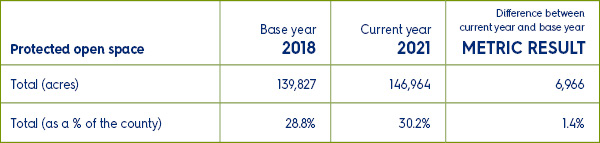
As of the current year (2021), a total of 146,964 acres of open space was preserved, both with and without county funding. This represents an increase of 6,966 acres (or 1.4%) relative to the base year (2018).
METRIC 2
Open Space Connectivity
Monitor protected open space within the conservation corridors.
METRIC result
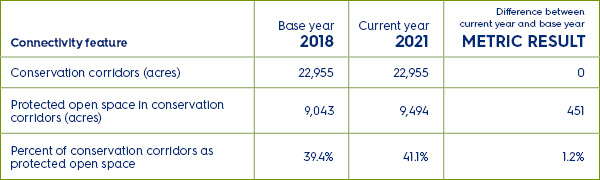
As of the current year (2021), a total of 9,494 acres of open space were protected within the 1/8th mile wide conservation corridors. This represents an increase of 451 acres relative to the base year.
METRIC 3
Protected Farmland
Track the percentage of farmland that is eligible for an agricultural conservation easement and has been protected from development.
METRIC result
During the current year (2021), the amount of farmland that was eligible for easement and has been protected from development was 83,845 acres. This represents an increase of 4,761 acres relative to the base year (2018).
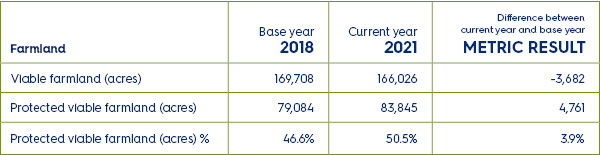
This metric addresses farmland that is well suited for protection with an agricultural conservation easement, which may not include all indoor facilities and some unconventional farm operations.
2020
METRIC 1
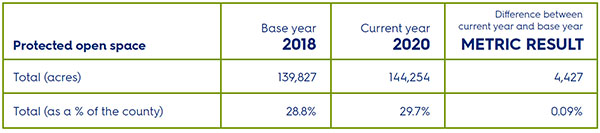
Protected Open Space
Track the percentage of permanently protected open space within the county, including farmland, nature preserves and parks.
METRIC result
As of the current year (2020), a total of 144,254 acres of open space was preserved, both with and without county funding. This represents an increase of 4,427 acres (or 0.9%) relative to the base year (2018).
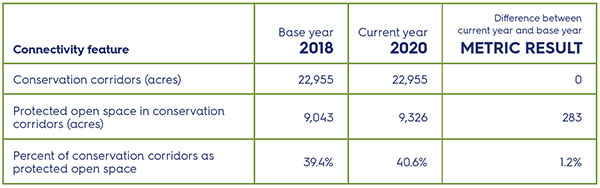
METRIC 2
Open Space Connectivity
Monitor protected open space within the conservation corridors.
METRIC result
As of the current year (2020), a total of 9,326 acres of open space were protected within the 1/8th mile wide conservation corridors. This represents an increase of 283 acres relative to the base year.
METRIC 3
Protected Farmland
Track the percentage of farmland that is eligible for an agricultural conservation easement and has been protected from development.
METRIC result
During the current year (2020), the amount of farmland that was eligible for easement and has been protected from development was 95,081 acres. This represents an increase of 2,478 acres relative to the base year (2018).
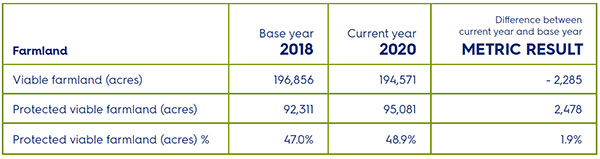
This metric addresses farmland that is well suited for protection with an agricultural conservation easement, which may not include all indoor facilities and some unconventional farm operations.
2019
METRIC 1
Protected Open Space
Track the percentage of permanently protected open space within the county, including farmland, nature preserves and parks.
METRIC result
As of the current year (2019), a total of 142,233 acres of open space was preserved, both with and without county funding. This represents an increase of 2,405 acres (or 0.5%) relative to the base year (2018)
METRIC 2
Open Space Connectivity
Monitor protected open space within the conservation corridors.
METRIC result
As of the current year (2019), a total of 9,147 acres of open space were protected within the 1/8th mile wide conservation corridors. This represents an increase of 103 acres relative to the base year
METRIC 3
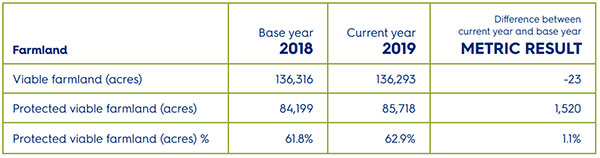
Protected Farmland
Track the percentage of farmland that is eligible for an agricultural conservation easement and has been protected from development.
METRIC result
During the current year (2019), the amount of farmland that was eligible for easement and had been protected from development was 85,718 acres, which is 62.9% of all the farmland that was eligible for easement. This represents an increase of 1,520 acres relative to the base year.
This metric addresses farmland that is well suited for protection with an agricultural conservation easement, which may not include all indoor facilities and some unconventional farm operations.